
Learning bite
Prometheus metrics and Grafana
Measure a specific behavior before building a dashboard.
On this page
Name the question first
For MicroBank, begin with three questions: is the local journey succeeding, when did it last run, and how long did it take? A dashboard of CPU alone cannot answer whether an accepted deposit reached Ledger.
Prometheus scrapes numeric time series. Counters record accumulating events; gauges describe current values; histograms group observations into buckets. Grafana queries the data source and displays the result. Installing Grafana does not instrument the application.
The inspected MicroBank source does not provide an application Prometheus endpoint. The module lab therefore adds a small local probe exporter. Its measurements describe that probe's observations, not all user traffic.
Connect the signals before choosing a dashboard
Metrics summarize numeric behavior across time. Logs describe individual events with context. Traces connect timed operations within a request or message flow when context is propagated. Kubernetes events report control-plane observations such as a failed scheduling attempt. A rising failure metric tells you when and how much; a log or trace may help explain an affected operation. None fills a gap the application never measured.
Prometheus periodically requests an HTTP metrics endpoint; this is a scrape. A metric name and its label values identify a time series. For a counter, a raw total says little about the present rate: 600 requests since startup could mean a busy minute or a quiet week. rate(counter[5m]) estimates per-second growth over the selected range and accounts for counter resets. A gauge already represents a value such as queue depth; applying counter logic to it changes the question incorrectly. Histograms retain counts in buckets so you can reason about latency distributions; an average alone hides the slow tail.
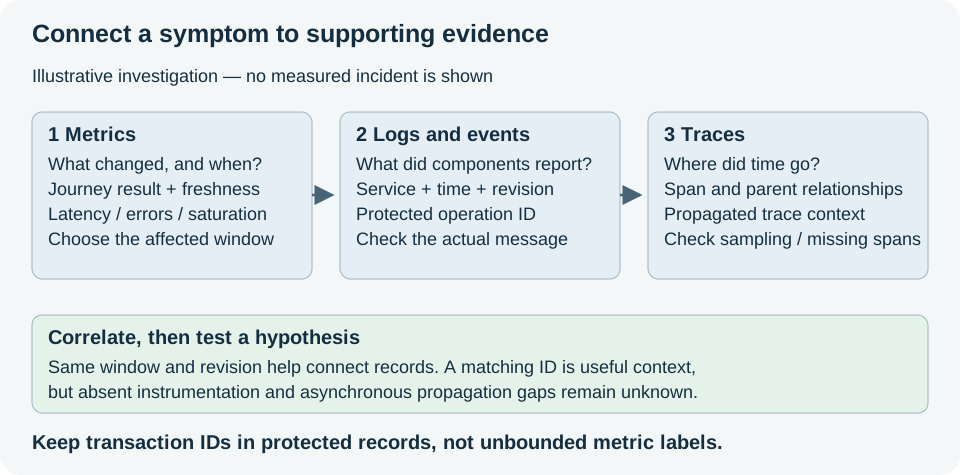
Follow the figure from symptom to supporting records. It illustrates an investigation, not an implemented end-to-end MicroBank trace. Check the actual instrumentation before assuming any correlation field exists.
Interpret a tiny sample before installing anything
Use these invented observations in a note. At time 1000, the exporter has success=1, duration=0.4, and completed=990; Prometheus last scraped it successfully. The result passed and is 10 seconds old. At time 1200, the exporter is still scrapeable but completed is still 990. Its last result is now 210 seconds old. You know the exporter responds, but you lack a recent completed journey.
Try these expressions once the module lab exposes those metrics:
microbank_journey_success
time() - microbank_journey_completed_timestamp_seconds
up{job="microbank-probe"}
The first is a last-result gauge, not a fraction of all requests. The second is age in seconds; a zero completion timestamp means no completed observation yet. The third describes scrape success. With a hypothetical 120-second freshness limit, the second sample is stale even though up=1. In Grafana, use distinct panels and units so these facts cannot collapse into one misleading green badge.
Keep series cardinality bounded
Use labels such as environment and component. Never label every account, email, transaction ID, URL containing IDs, or exception message. Each unique label combination creates another series, and a tiny lab can grow unexpectedly.
The lab exposes:
| Metric | Interpretation |
|---|---|
microbank_journey_success | Result of the last completed check |
microbank_journey_duration_seconds | Duration of that check |
microbank_journey_completed_timestamp_seconds | Freshness of its evidence |
up{job="microbank-probe"} | Prometheus could scrape the exporter |
A value of up=1 can coexist with a failed journey. Show when a successful result becomes too old to trust.
Revision check
Create three panels: latest result, seconds since the last completion, and duration over time. Specify units and the evaluation window. Show missing data explicitly. Save the dashboard JSON with the lab configuration after verifying it against actual metric names. Explain why one passing probe is not an availability claim.
Map the golden signals to this application
For MicroBank, latency could describe request handling or asynchronous settlement; state which one is measured. Traffic could count accepted requests, while errors should distinguish HTTP rejection from a failed user journey. Saturation might appear as CPU pressure, database contention, or queue backlog. Use the metric names your instrumentation actually exposes.
Create a small table with question, actual signal, collection source, freshness, and blind spot. The existing local exporter observes a saved-case read. It does not measure all deposits, full settlement latency, or browser experience. Add instrumentation only when you can explain and verify its semantics.
Revision answer: a stale success, a fresh failure, and a missing series require different displays. Keep the absent state visible. For label practice, 2 environments × 3 components yields 6 combinations before any other labels; multiplying by 10,000 transaction IDs can create 60,000. Keep identifiers in protected logs or saved cases instead. Next, turn the three observable conditions into alert rules with explicit responses.
Sources
Prometheus metric types↗, instrumentation practices↗, and Grafana Prometheus datasource↗.
Your notes and evidence
Record observations, questions, or links to your work. Keep credentials out of your notes.
Back up or restore this path
Progress and notes stay in this browser. A backup contains only this learning path.